4. Data Exploration
Note
Know yourself and know your enemy, and you will never be defeated – idiom, from Sunzi’s Art of War
4.1. Procedures
Data mining is a complex process that aims to discover patterns in large data sets starting from a collection of exsting data. In my opinion, data minig contains four main steps:
- Collecting data: This is a complex step, I will assume we have already gotten the datasets.
- Pre-processing: In this step, we need to try to understand your data, denoise, do dimentation reduction and select proper predictors etc.
- Feeding data mining: In this step, we need to use your data to feed your model.
- Post-processing : In this step, we need to interpret and evaluate your model.
In this section, we will try to know our enemy – datasets. We will learn how to load data, how to understand data with statistics method and how to underdtand data with visualization. Next, we will start with Loading Datasets for the Pre-processing.
4.2. Datasets in this Tutorial
The datasets for this tutorial are available to download: Heart, Energy Efficienency. Those data are from my course matrials, the copyrights blongs to the origial authors.
4.3. Loading Datasets
There are three main data source database, *.csv and *.xlsx. We will show how to load those two types of data in R and Python, respectively.
4.3.1. Loading table format database
User and Database information:
user = '*******'
pw='********'
host = '**.***.***.**'
database = '**'
table_name = '***'
Python
- Loading data from database in Python
# import library
import psycopg2
import pandas as pd

# Create the database connection
conn = psycopg2.connect(host=host, database=database,
                        user=user, password=pw)
cur = conn.cursor()

# Create the SQL query string.
sql = """
      SELECT *
      FROM {table_name}
      """.format(table_name=table_name)
df = pd.read_sql(sql, conn)

df.head(4)
R
- Loading data from database in R
# load the library
library("sqldf")
library('RODBC')
library('RPostgreSQL')

# Create a driver
drv <- DBI::dbDriver( "PostgreSQL" )
# Create the database connection
conn <- dbConnect( drv, dbname = database, host = host,port = '5432',
                   user = user, password = pw )

# Create the SQL query string. Include a semi-colon to terminate
querystring = sprintf('SELECT * FROM %s;', table_name)
# Execute the query and return results as a data frame
df = dbGetQuery(conn, querystring )

head(df)
4.3.2. Loading data from .csv
Python
- Loading data from
.csvin Python
import pandas as pd

# set data path
path ='~/Dropbox/MachineLearningAlgorithms/python_code/data/Heart.csv'

# read data set
rawdata = pd.read_csv(path)
R
- Loading data from
.csvin R
# set the path or enverionment
setwd("/home/feng/R-language/sat577/HW#4/data")

# read data set
rawdata = read.csv("spam.csv")
4.3.3. Loading data from .xlsx
Python
- Loading data from
.xlsxin Python
import pandas as pd

# set data path
path = ('/home/feng/Dropbox/MachineLearningAlgorithms/python_code/data/'
'energy_efficiency.xlsx')

# read data set from first sheet
rawdata= pd.read_excel(path,sheetname=0)
R
- Loading data from
.xlsxin R
# set the path or enverionment
setwd("~/Dropbox/R-language/sat577/")

#install.packages("readxl") # CRAN version
library(readxl)

# read data set
energy_eff=read_excel("energy_efficiency.xlsx")
4.4. Audit Data
In my opinion, data auditing is the first step you need to do when you get your dataset. Since you need to know whether the data quality is good enough or not. My PyAudit: Python Data Audit Library can be found at: PyAudit. You can install the PyAudit from [PyPI](https://pypi.org/project/PyAudit):
pip install PyAudit
4.4.1. Check missing rate
Python
- Checking missing rate in Python
import pandas as pd

d = {'A': [1, 2, None, 3],
     'B': [None, None, 4, 5],
     'C': [None, 'b', 'c', 'd']}

# create DataFrame
df = pd.DataFrame(d)
print(df)


# define the missing rate function
def missing_rate(df_in):
    # calculate missing rate and transpose the DataFrame
    rate = df_in.isnull().sum() / df_in.shape[0]
    # rename the column
    rate = pd.DataFrame(rate).reset_index()\
                             .rename(columns={'index': 'feature', 0: 'missing_rate'})
    print(rate)


missing_rate(df)
The results:
     A    B     C
0  1.0  NaN  None
1  2.0  NaN     b
2  NaN  4.0     c
3  3.0  5.0     d
  feature  missing_rate
0       A          0.25
1       B          0.50
2       C          0.25
R
- Checking missing rate in R
# create DataFrame
x = data.frame(A = c(1, 2, NA, 3), B = c(NA, NA, 4, 5), C = c(NA, 'b', 'c', 'd'))

# loding library
library('dplyr')
#library('tidyverse')

# define the missing rate function
missing_rate <- function(df){
  # calculate missing rate and transpose the DataFrame
  rate <-t( df %>% summarize_all(funs(sum(is.na(.)) / length(.))))
  # rename the column
  colnames(rate)[1] <- "missing_rate"
  print(rate)
}

x

missing_rate(x)
The results:
> x
   A  B    C
1  1 NA <NA>
2  2 NA    b
3 NA  4    c
4  3  5    d
> missing_rate(x)
  missing_rate
A         0.25
B         0.50
C         0.25
4.4.2. Checking zero variance features
Python
- Checking zero variance features in Python
import pandas as pd

d = {'A': [1, 2, 3, 3],
     'B': [1, 1, 1, 1],
     'C': ['a', 'b', 'c', 'd']}

# create DataFrame
df = pd.DataFrame(d)
print(df)


def zero_variance(df_in):

    counts = df_in.nunique()
    counts = pd.DataFrame(counts)\
               .reset_index().rename(columns={'index': 'feature', 0: 'count'})
    return list(counts[counts['count'] == 1]['feature'])

print(zero_variance(df))
   A  B  C
0  1  1  a
1  2  1  b
2  3  1  c
3  3  1  d
['B']
R
- Checking zero variance features in R
df = data.frame(A = c(1, 2, 3, 3), B = c(1, 1, 1, 1), C = c('a', 'b', 'c', 'd'))

zero_variance <- function(df){
  compData <- data.frame(feature= c(NA), count= c(NA))
  for(i in 1:ncol(df))
  {
    compData[i, ] <- c(colnames(df)[i],length(unique(df[,i])))
  }
  return(compData[compData$count==1,]$feature)
}
> zero_variance(df)
[1] "B"
4.5. Understand Data With Statistics methods
After we get the data in hand, then we can try to understand them. I will use “Heart.csv” dataset as a example to demonstrate how to use those statistics methods.
4.5.1. Summary of the data
It is always good to have a glance over the summary of the data. Since from the summary you will know some statistics features of your data, and you will also know whether you data contains missing data or not.
Python
- Summary of the data in Python
print("> data summary")
print rawdata.describe()
Then you will get
> data summary
              Age         Sex      RestBP        Chol         Fbs     RestECG  \
count  303.000000  303.000000  303.000000  303.000000  303.000000  303.000000
mean    54.438944    0.679868  131.689769  246.693069    0.148515    0.990099
std      9.038662    0.467299   17.599748   51.776918    0.356198    0.994971
min     29.000000    0.000000   94.000000  126.000000    0.000000    0.000000
25%     48.000000    0.000000  120.000000  211.000000    0.000000    0.000000
50%     56.000000    1.000000  130.000000  241.000000    0.000000    1.000000
75%     61.000000    1.000000  140.000000  275.000000    0.000000    2.000000
max     77.000000    1.000000  200.000000  564.000000    1.000000    2.000000

       MaxHR       ExAng     Oldpeak       Slope          Ca
count  303.000000  303.000000  303.000000  303.000000  299.000000
mean   149.607261    0.326733    1.039604    1.600660    0.672241
std     22.875003    0.469794    1.161075    0.616226    0.937438
min     71.000000    0.000000    0.000000    1.000000    0.000000
25%    133.500000    0.000000    0.000000    1.000000    0.000000
50%    153.000000    0.000000    0.800000    2.000000    0.000000
75%    166.000000    1.000000    1.600000    2.000000    1.000000
max    202.000000    1.000000    6.200000    3.000000    3.000000
R
- Summary of the data in R
summary(rawdata)
Then you will get
 > summary(rawdata)
         Age             Sex                ChestPain       RestBP
Min.   :29.00   Min.   :0.0000   asymptomatic:144   Min.   : 94.0
        1st Qu.:48.00   1st Qu.:0.0000   nonanginal  : 86   1st Qu.:120.0
Median :56.00   Median :1.0000   nontypical  : 50   Median :130.0
Mean   :54.44   Mean   :0.6799   typical     : 23   Mean   :131.7
3rd Qu.:61.00   3rd Qu.:1.0000                      3rd Qu.:140.0
Max.   :77.00   Max.   :1.0000                      Max.   :200.0

        Chol            Fbs            RestECG           MaxHR
Min.   :126.0   Min.   :0.0000   Min.   :0.0000   Min.   : 71.0
1st Qu.:211.0   1st Qu.:0.0000   1st Qu.:0.0000   1st Qu.:133.5
Median :241.0   Median :0.0000   Median :1.0000   Median :153.0
Mean   :246.7   Mean   :0.1485   Mean   :0.9901   Mean   :149.6
3rd Qu.:275.0   3rd Qu.:0.0000   3rd Qu.:2.0000   3rd Qu.:166.0
Max.   :564.0   Max.   :1.0000   Max.   :2.0000   Max.   :202.0

       ExAng           Oldpeak         Slope             Ca
Min.   :0.0000   Min.   :0.00   Min.   :1.000   Min.   :0.0000
1st Qu.:0.0000   1st Qu.:0.00   1st Qu.:1.000   1st Qu.:0.0000
Median :0.0000   Median :0.80   Median :2.000   Median :0.0000
Mean   :0.3267   Mean   :1.04   Mean   :1.601   Mean   :0.6722
3rd Qu.:1.0000   3rd Qu.:1.60   3rd Qu.:2.000   3rd Qu.:1.0000
Max.   :1.0000   Max.   :6.20   Max.   :3.000   Max.   :3.0000
                                              NA's   :4
            Thal      AHD
fixed     : 18   No :164
normal    :166   Yes:139
reversable:117
NA's      :  2
4.5.2. The size of the data
Most of time, we also need to know the size or dimension of our data. Such as when you need to extract the response from the dataset, you need the number of column, or when you try to split your data into train and test data set, you need know the number of row.
Python
- Checking size in Python
nrow, ncol = rawdata.shape
print nrow, ncol
or you can use the follwing code
nrow=rawdata.shape[0] #gives number of row count
ncol=rawdata.shape[1] #gives number of col count
print(nrow, ncol)
Then you will get
Raw data size
303 14
R
- Checking size in R
dim(rawdata)
Or you can use the following code
nrow=nrow(rawdata)
ncol=ncol(rawdata)

c(nrow, ncol)
Then you will get
> dim(rawdata)
[1] 303  14
4.5.3. Data type of the features
Data type is also very important, since some functions or methods can not be applied to the qualitative data or some machine learning algorithm will take some types as categorical data, you need to remove those features or transform them into quantitative data.
Python
- Checking data type in Pyhton
print(rawdata.dtypes)
Then you will get
  Data Format:
Age            int64
Sex            int64
ChestPain     object
RestBP         int64
Chol           int64
Fbs            int64
RestECG        int64
MaxHR          int64
ExAng          int64
Oldpeak      float64
Slope          int64
Ca           float64
Thal          object
AHD           object
dtype: object
R
- Checking data format in R
# install the package
install.packages("mlbench")
library(mlbench)

sapply(rawdata, class)
Then you will get
   > sapply(rawdata, class)
    Age       Sex ChestPain    RestBP      Chol       Fbs   RestECG
"integer" "integer"  "factor" "integer" "integer" "integer" "integer"
MaxHR     ExAng   Oldpeak     Slope        Ca      Thal       AHD
"integer" "integer" "numeric" "integer" "integer"  "factor"  "factor"
4.5.4. The column names
Python
- Checking column names of the data in Python
colNames = rawdata.columns.tolist()

print "Column names:"
print colNames
Then you will get
Column names:
['Age', 'Sex', 'ChestPain', 'RestBP', 'Chol', 'Fbs', 'RestECG', 'MaxHR',
 'ExAng', 'Oldpeak', 'Slope', 'Ca', 'Thal', 'AHD']
R
- Checking column names of the data in R
colnames(rawdata)
attach(rawdata) # enable you can directly use name as features
Then you will get
   > colnames(rawdata)
[1] "Age"       "Sex"       "ChestPain" "RestBP"    "Chol"
[6] "Fbs"       "RestECG"   "MaxHR"     "ExAng"     "Oldpeak"
[11] "Slope"     "Ca"        "Thal"      "AHD"
4.5.5. The first or last parts of the data
Python
- Checking first parts of the data in Python
print("\n Sample data:")
print(rawdata.head(6))
Then you will get
 Sample data:
    Age  Sex     ChestPain  RestBP  Chol  Fbs  RestECG  MaxHR  ExAng  Oldpeak  \
0   63    1       typical     145   233    1        2    150      0      2.3
1   67    1  asymptomatic     160   286    0        2    108      1      1.5
2   67    1  asymptomatic     120   229    0        2    129      1      2.6
3   37    1    nonanginal     130   250    0        0    187      0      3.5
4   41    0    nontypical     130   204    0        2    172      0      1.4
5   56    1    nontypical     120   236    0        0    178      0      0.8

   Slope  Ca        Thal  AHD
0      3   0       fixed   No
1      2   3      normal  Yes
2      2   2  reversable  Yes
3      3   0      normal   No
4      1   0      normal   No
5      1   0      normal   No
R
- Checking first parts of the data in R
head(rawdata)
Then you will get
> head(rawdata)
   Age Sex    ChestPain RestBP Chol Fbs RestECG MaxHR ExAng Oldpeak
 1  63   1      typical    145  233   1       2   150     0     2.3
 2  67   1 asymptomatic    160  286   0       2   108     1     1.5
 3  67   1 asymptomatic    120  229   0       2   129     1     2.6
 4  37   1   nonanginal    130  250   0       0   187     0     3.5
 5  41   0   nontypical    130  204   0       2   172     0     1.4
 6  56   1   nontypical    120  236   0       0   178     0     0.8
    Slope Ca       Thal AHD
 1     3  0      fixed  No
 2     2  3     normal Yes
 3     2  2 reversable Yes
 4     3  0     normal  No
 5     1  0     normal  No
 6     1  0     normal  No
You can use the samilar way (tail) to check the last part of the data, for simplicity, i will skip it.
4.5.6. Correlation Matrix
Python
- Computing correlation matrix in Python
print("\n correlation Matrix")
print(rawdata.corr())
Then you will get
 correlation Matrix
           Age       Sex    RestBP      Chol       Fbs   RestECG     MaxHR  \
Age      1.000000 -0.097542  0.284946  0.208950  0.118530  0.148868 -0.393806
Sex     -0.097542  1.000000 -0.064456 -0.199915  0.047862  0.021647 -0.048663
RestBP   0.284946 -0.064456  1.000000  0.130120  0.175340  0.146560 -0.045351
Chol     0.208950 -0.199915  0.130120  1.000000  0.009841  0.171043 -0.003432
Fbs      0.118530  0.047862  0.175340  0.009841  1.000000  0.069564 -0.007854
RestECG  0.148868  0.021647  0.146560  0.171043  0.069564  1.000000 -0.083389
MaxHR   -0.393806 -0.048663 -0.045351 -0.003432 -0.007854 -0.083389  1.000000
ExAng    0.091661  0.146201  0.064762  0.061310  0.025665  0.084867 -0.378103
Oldpeak  0.203805  0.102173  0.189171  0.046564  0.005747  0.114133 -0.343085
Slope    0.161770  0.037533  0.117382 -0.004062  0.059894  0.133946 -0.385601
Ca       0.362605  0.093185  0.098773  0.119000  0.145478  0.128343 -0.264246

          ExAng   Oldpeak     Slope        Ca
Age      0.091661  0.203805  0.161770  0.362605
Sex      0.146201  0.102173  0.037533  0.093185
RestBP   0.064762  0.189171  0.117382  0.098773
Chol     0.061310  0.046564 -0.004062  0.119000
Fbs      0.025665  0.005747  0.059894  0.145478
RestECG  0.084867  0.114133  0.133946  0.128343
MaxHR   -0.378103 -0.343085 -0.385601 -0.264246
ExAng    1.000000  0.288223  0.257748  0.145570
Oldpeak  0.288223  1.000000  0.577537  0.295832
Slope    0.257748  0.577537  1.000000  0.110119
Ca       0.145570  0.295832  0.110119  1.000000
R
- Computing correlation matrix in R
# get numerical data and remove NAN
numdata=na.omit(rawdata[,c(1:2,4:12)])

# computing correlation matrix
cor(numdata)
Then you will get
    > cor(numdata)
             Age         Sex      RestBP         Chol          Fbs
Age      1.00000000 -0.09181347  0.29069633  0.203376601  0.128675921
Sex     -0.09181347  1.00000000 -0.06552127 -0.195907357  0.045861783
RestBP   0.29069633 -0.06552127  1.00000000  0.132284171  0.177623291
Chol     0.20337660 -0.19590736  0.13228417  1.000000000  0.006664176
Fbs      0.12867592  0.04586178  0.17762329  0.006664176  1.000000000
RestECG  0.14974915  0.02643577  0.14870922  0.164957542  0.058425836
MaxHR   -0.39234176 -0.05206445 -0.04805281  0.002179081 -0.003386615
ExAng    0.09510850  0.14903849  0.06588463  0.056387955  0.011636935
Oldpeak  0.19737552  0.11023676  0.19161540  0.040430535  0.009092935
Slope    0.15895990  0.03933739  0.12110773 -0.009008239  0.053776677
Ca       0.36260453  0.09318476  0.09877326  0.119000487  0.145477522
           RestECG        MaxHR       ExAng      Oldpeak        Slope
Age      0.14974915 -0.392341763  0.09510850  0.197375523  0.158959901
Sex      0.02643577 -0.052064447  0.14903849  0.110236756  0.039337394
RestBP   0.14870922 -0.048052805  0.06588463  0.191615405  0.121107727
Chol     0.16495754  0.002179081  0.05638795  0.040430535 -0.009008239
Fbs      0.05842584 -0.003386615  0.01163693  0.009092935  0.053776677
RestECG  1.00000000 -0.077798148  0.07408360  0.110275054  0.128907169
MaxHR   -0.07779815  1.000000000 -0.37635897 -0.341262236 -0.381348495
ExAng    0.07408360 -0.376358975  1.00000000  0.289573103  0.254302081
Oldpeak  0.11027505 -0.341262236  0.28957310  1.000000000  0.579775260
Slope    0.12890717 -0.381348495  0.25430208  0.579775260  1.000000000
Ca       0.12834265 -0.264246253  0.14556960  0.295832115  0.110119188
            Ca
Age      0.36260453
Sex      0.09318476
RestBP   0.09877326
Chol     0.11900049
Fbs      0.14547752
RestECG  0.12834265
MaxHR   -0.26424625
ExAng    0.14556960
Oldpeak  0.29583211
Slope    0.11011919
Ca       1.00000000
4.5.7. Covariance Matrix
Python
- Computing covariance matrix in Python
print("\n covariance Matrix")
print(rawdata.corr())
Then you will get
covariance Matrix
            Age       Sex      RestBP         Chol       Fbs   RestECG  \
Age      81.697419 -0.411995   45.328678    97.787489  0.381614  1.338797
Sex      -0.411995  0.218368   -0.530107    -4.836994  0.007967  0.010065
RestBP   45.328678 -0.530107  309.751120   118.573339  1.099207  2.566455
Chol     97.787489 -4.836994  118.573339  2680.849190  0.181496  8.811521
Fbs       0.381614  0.007967    1.099207     0.181496  0.126877  0.024654
RestECG   1.338797  0.010065    2.566455     8.811521  0.024654  0.989968
MaxHR   -81.423065 -0.520184  -18.258005    -4.064651 -0.063996 -1.897941
ExAng     0.389220  0.032096    0.535473     1.491345  0.004295  0.039670
Oldpeak   2.138850  0.055436    3.865638     2.799282  0.002377  0.131850
Slope     0.901034  0.010808    1.273053    -0.129598  0.013147  0.082126
Ca        3.066396  0.040964    1.639436     5.791385  0.048394  0.119706

            MaxHR     ExAng   Oldpeak     Slope        Ca
Age      -81.423065  0.389220  2.138850  0.901034  3.066396
Sex       -0.520184  0.032096  0.055436  0.010808  0.040964
RestBP   -18.258005  0.535473  3.865638  1.273053  1.639436
Chol      -4.064651  1.491345  2.799282 -0.129598  5.791385
Fbs       -0.063996  0.004295  0.002377  0.013147  0.048394
RestECG   -1.897941  0.039670  0.131850  0.082126  0.119706
MaxHR    523.265775 -4.063307 -9.112209 -5.435501 -5.686270
ExAng     -4.063307  0.220707  0.157216  0.074618  0.064162
Oldpeak   -9.112209  0.157216  1.348095  0.413219  0.322753
Slope     -5.435501  0.074618  0.413219  0.379735  0.063747
Ca        -5.686270  0.064162  0.322753  0.063747  0.878791
R
- Computing covariance matrix in R
# get numerical data and remove NAN
numdata=na.omit(rawdata[,c(1:2,4:12)])

# computing covariance matrix
cov(numdata)
Then you will get
 > cov(numdata)
                Age          Sex      RestBP         Chol          Fbs
 Age      81.3775448 -0.388397567  46.4305852   95.2454603  0.411909946
Sex      -0.3883976  0.219905277  -0.5440170   -4.7693542  0.007631703
 RestBP   46.4305852 -0.544016969 313.4906736  121.5937353  1.116001885
 Chol     95.2454603 -4.769354223 121.5937353 2695.1442616  0.122769410
 Fbs       0.4119099  0.007631703   1.1160019    0.1227694  0.125923099
 RestECG   1.3440551  0.012334179   2.6196943    8.5204709  0.020628044
 MaxHR   -81.2442706 -0.560447577 -19.5302126    2.5968104 -0.027586362
 ExAng     0.4034028  0.032861215   0.5484838    1.3764001  0.001941595
 Oldpeak   2.0721791  0.060162510   3.9484299    2.4427678  0.003755247
 Slope     0.8855132  0.011391439   1.3241566   -0.2887926  0.011784247
 Ca        3.0663958  0.040964288   1.6394357    5.7913852  0.048393975
        RestECG        MaxHR        ExAng      Oldpeak       Slope
 Age      1.34405513 -81.24427061  0.403402842  2.072179076  0.88551323
 Sex      0.01233418  -0.56044758  0.032861215  0.060162510  0.01139144
 RestBP   2.61969428 -19.53021257  0.548483760  3.948429889  1.32415658
 Chol     8.52047092   2.59681040  1.376400081  2.442767839 -0.28879262
 Fbs      0.02062804  -0.02758636  0.001941595  0.003755247  0.01178425
 RestECG  0.98992166  -1.77682880  0.034656910  0.127690736  0.07920136
 MaxHR   -1.77682880 526.92866602 -4.062052479 -9.116871675 -5.40571480
 ExAng    0.03465691  -4.06205248  0.221072479  0.158455478  0.07383673
 Oldpeak  0.12769074  -9.11687168  0.158455478  1.354451303  0.41667415
 Slope    0.07920136  -5.40571480  0.073836726  0.416674149  0.38133824
 Ca       0.11970551  -5.68626967  0.064162421  0.322752576  0.06374717
           Ca
 Age      3.06639582
 Sex      0.04096429
 RestBP   1.63943570
 Chol     5.79138515
 Fbs      0.04839398
 RestECG  0.11970551
 MaxHR   -5.68626967
 ExAng    0.06416242
 Oldpeak  0.32275258
 Slope    0.06374717
 Ca       0.87879060
4.6. Understand Data With Visualization
A picture is worth a thousand words. You will see the powerful impact of the figures in this section.
4.6.1. Summary plot of data in figure
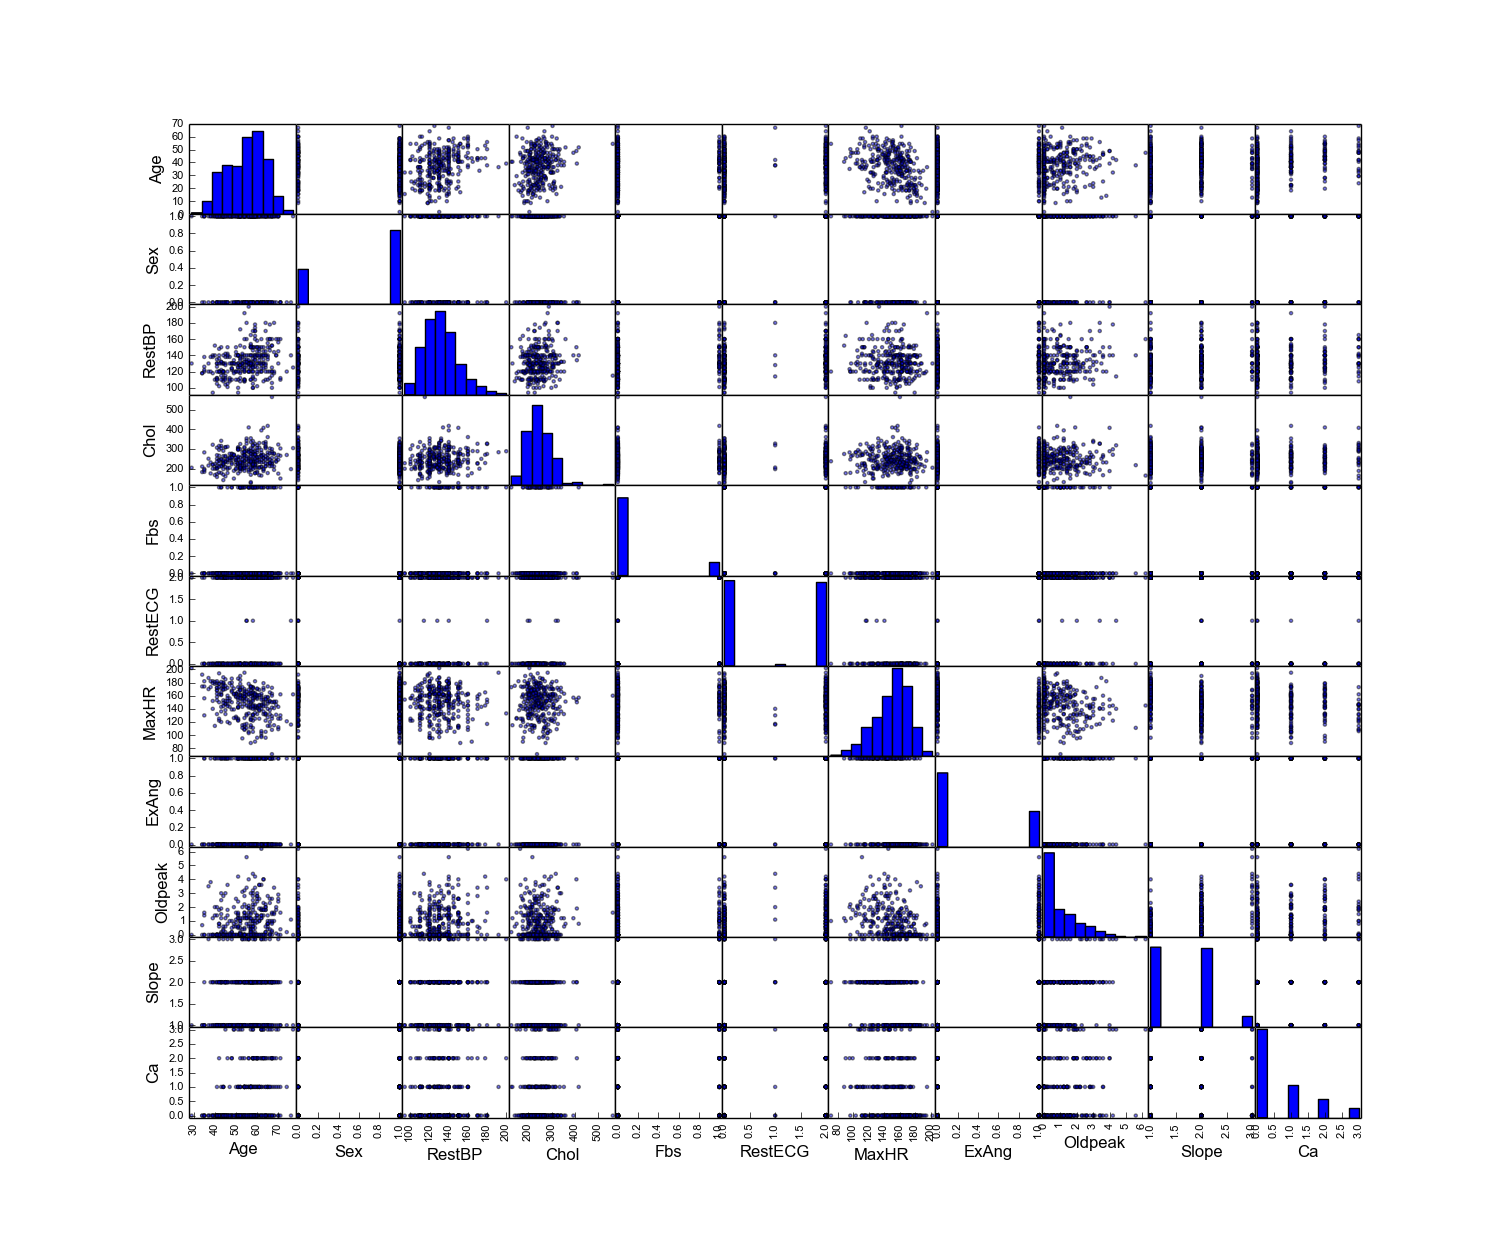
Python
- Summary plot in Python
# plot of the summary
plot(rawdata)
Then you will get Figure Summary plot of the data with Python.
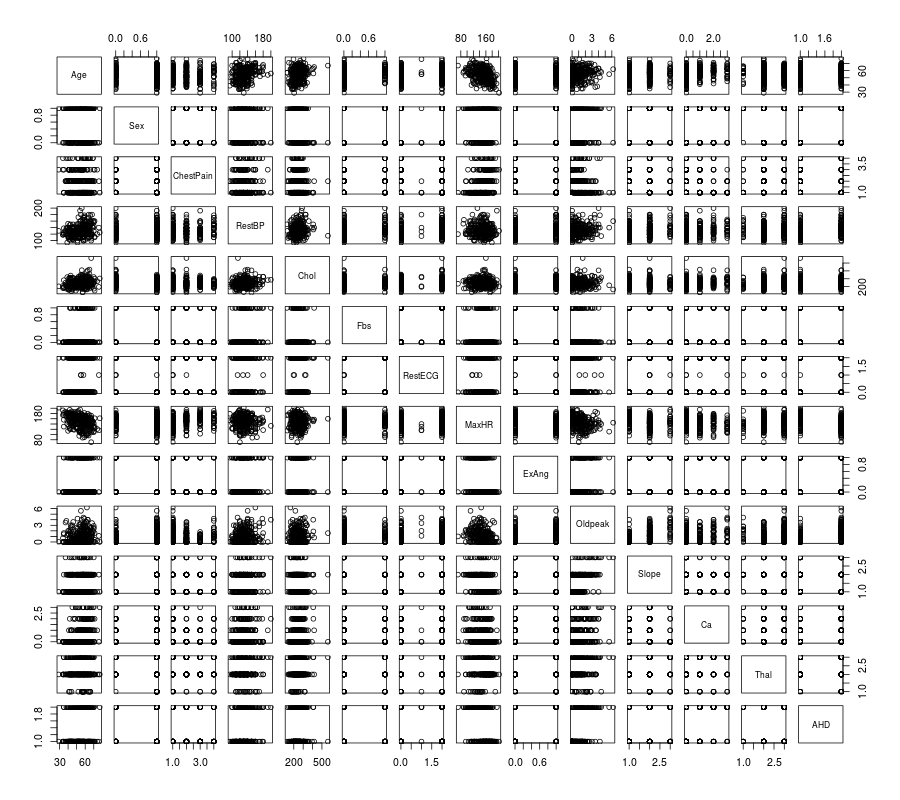
R
- Summary plot in R
# plot of the summary
plot(rawdata)
Then you will get Figure Summary plot of the data with R.
4.6.2. Histogram of the quantitative predictors
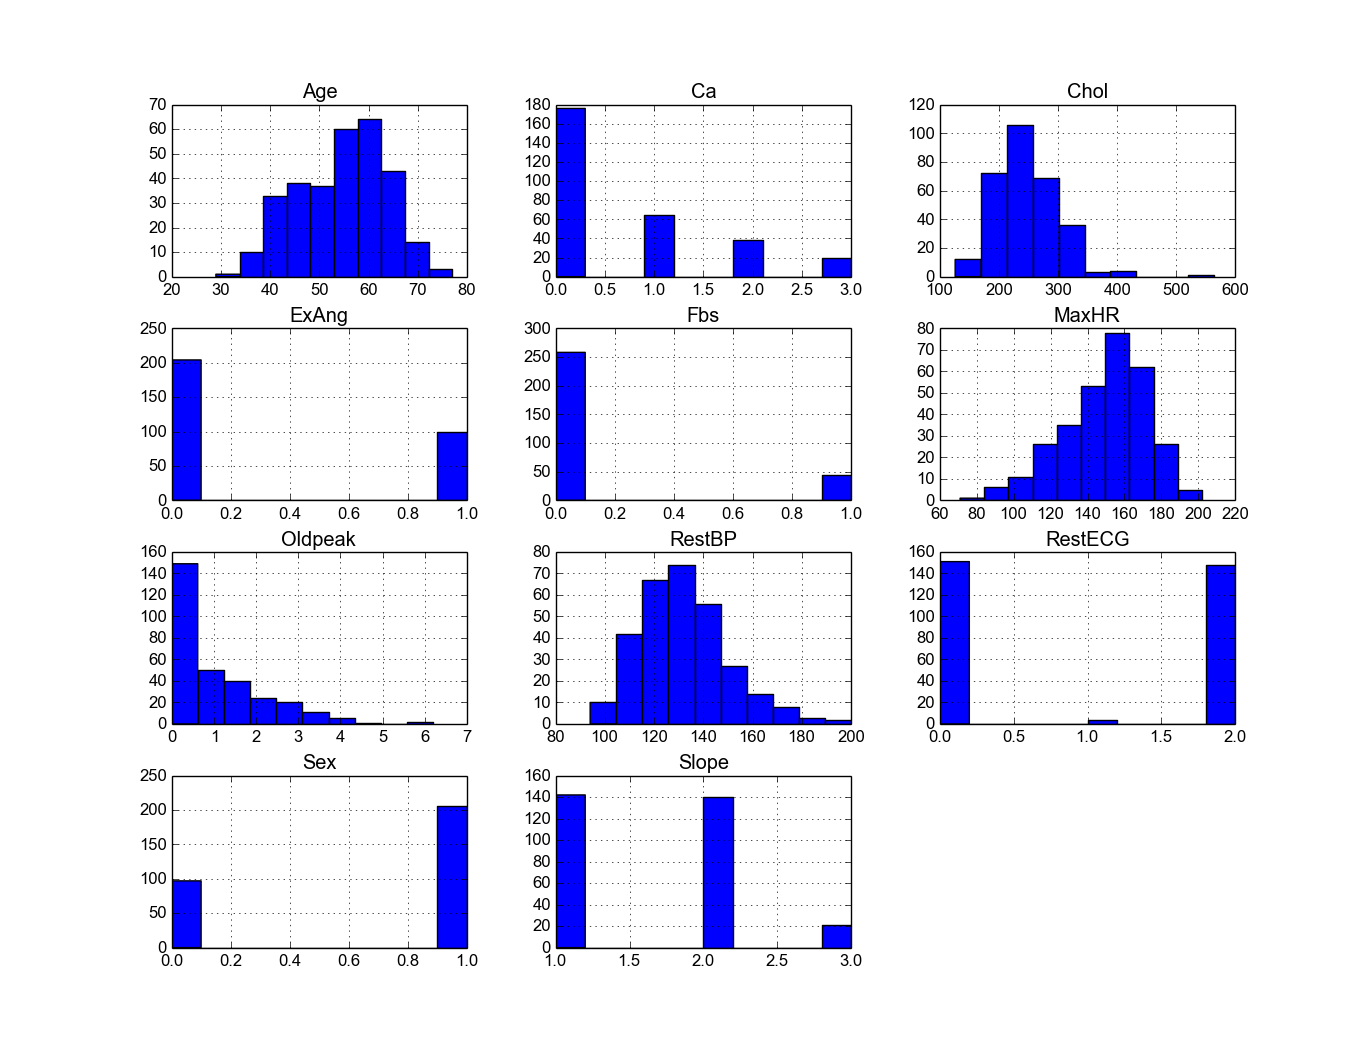
Python
- Histogram in Python
# Histogram
rawdata.hist()
plt.show()
Then you will get Figure Histogram in Python.
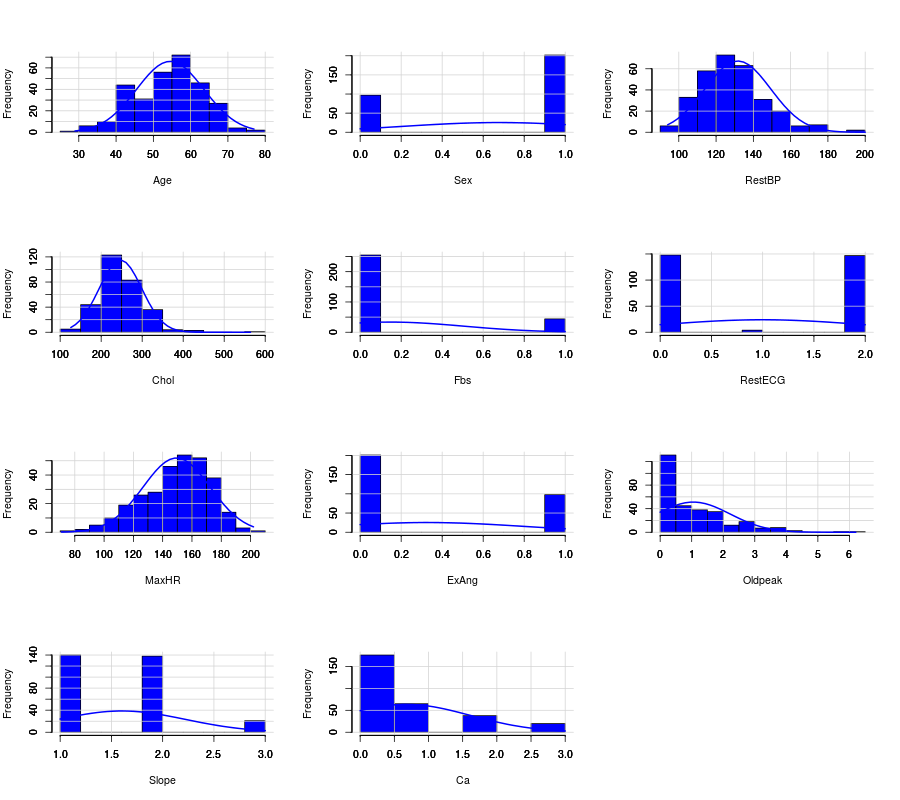
R
- Histogram in R
# Histogram with normal curve plot
dev.off()
Nvars=ncol(numdata)
name=colnames(numdata)
par(mfrow =c (4,3))
for (i in 1:Nvars)
{
  x<- numdata[,i]
  h<-hist(x, breaks=10, freq=TRUE, col="blue", xlab=name[i],main=" ",
            font.lab=1)
  axis(1, tck=1, col.ticks="light gray")
  axis(1, tck=-0.015, col.ticks="black")
  axis(2, tck=1, col.ticks="light gray", lwd.ticks="1")
  axis(2, tck=-0.015)
  xfit<-seq(min(x),max(x),length=40)
  yfit<-dnorm(xfit,mean=mean(x),sd=sd(x))
  yfit <- yfit*diff(h$mids[1:2])*length(x)
  lines(xfit, yfit, col="blue", lwd=2)
}
Then you will get Figure Histogram with normal curve plot in R.
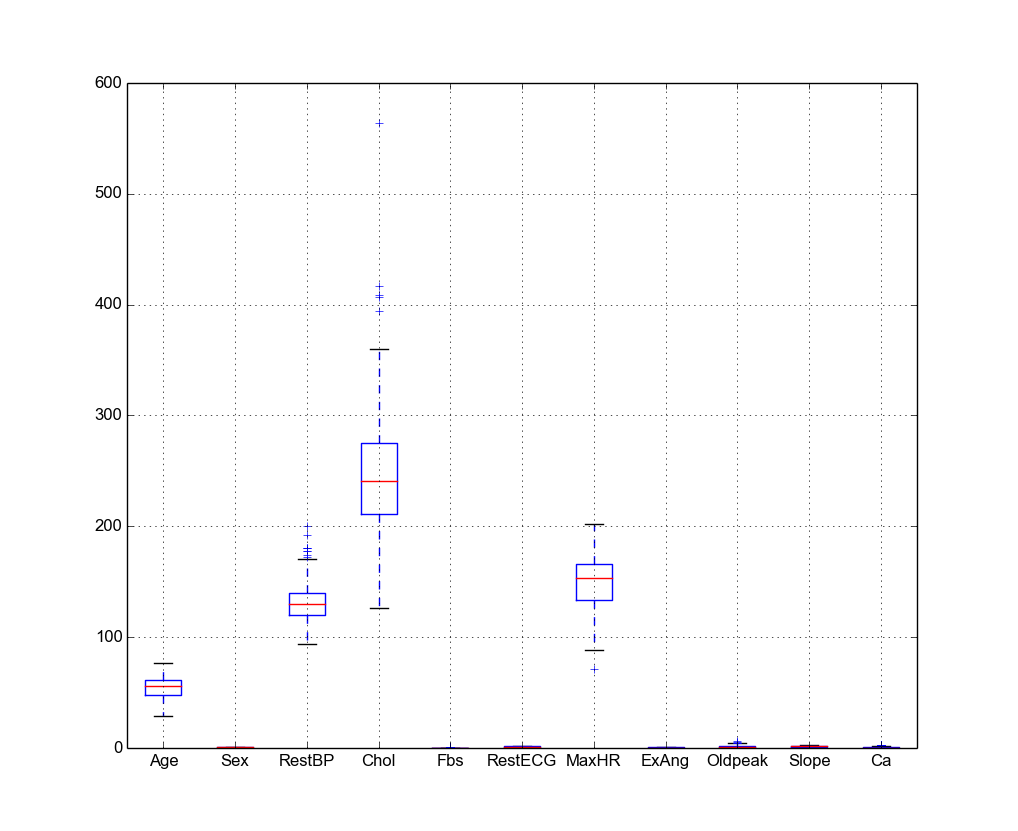
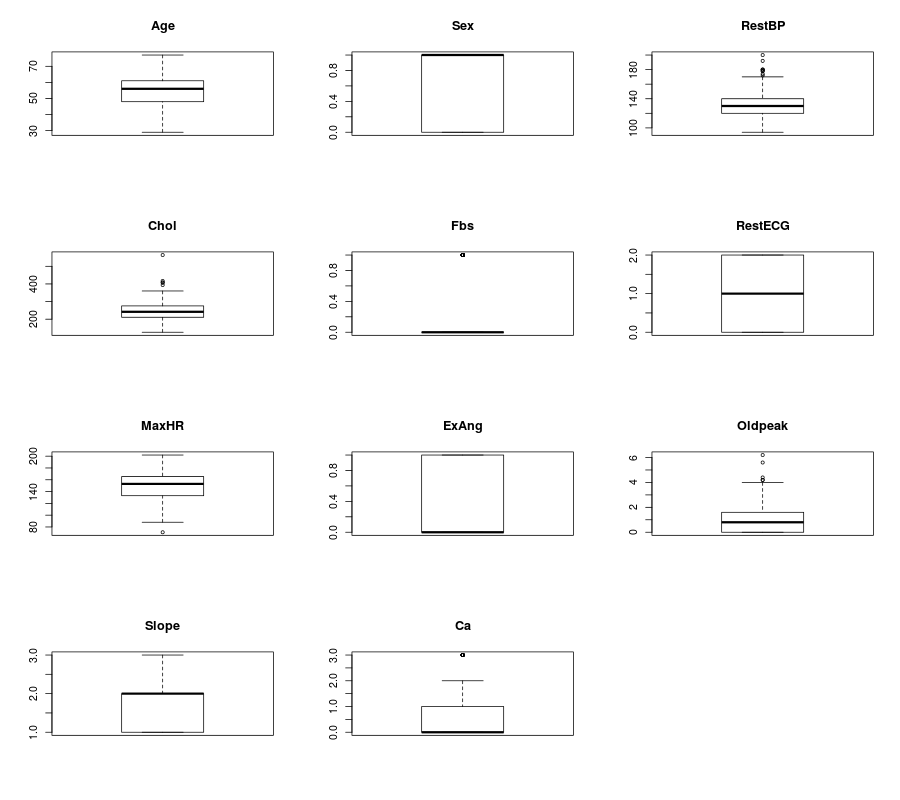
4.6.3. Boxplot of the quantitative predictors
Python
- Boxplot in Python
# boxplot
pd.DataFrame.boxplot(rawdata)
plt.show()
Then you will get Figure Histogram in Python.
R
- Boxplot in R
dev.off()
name=colnames(numdata)
      Nvars=ncol(numdata)
      # boxplot
      par(mfrow =c (4,3))
      for (i in 1:Nvars)
      {
       #boxplot(numdata[,i]~numdata[,Nvars],data=data,main=name[i])
       boxplot(numdata[,i],data=numdata,main=name[i])
      }
Then you will get Figure Boxplots in R.
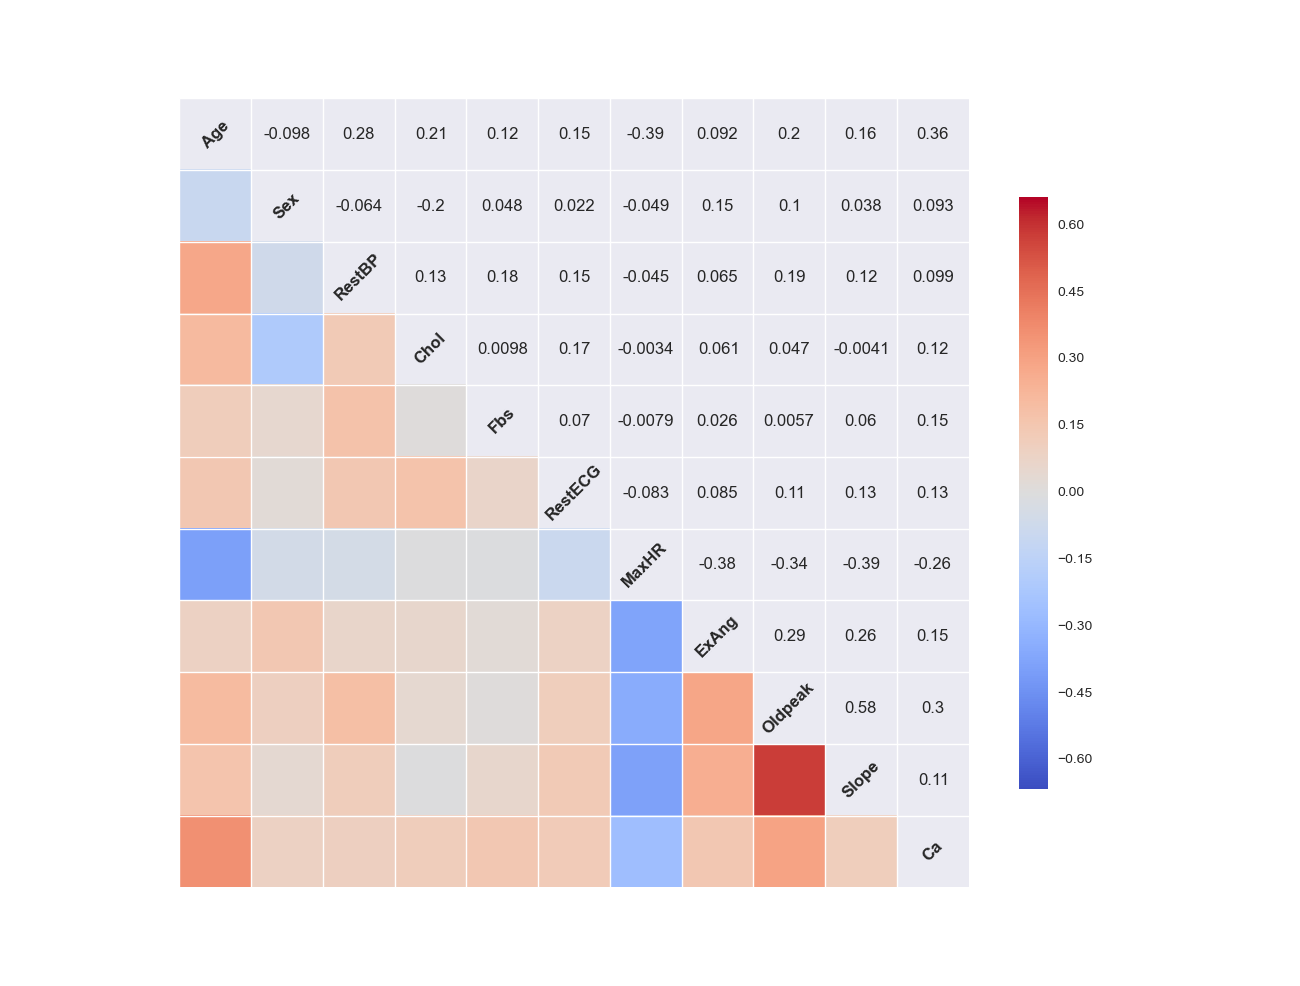
4.6.4. Correlation Matrix plot of the quantitative predictors
Python
- Correlation Matrix plot in Python
# cocorrelation Matrix plot
pd.DataFrame.corr(rawdata)
plt.show()
Then you will get get Figure Correlation Matrix plot in Python.
R
- Correlation Matrix plot in R
dev.off()
# laod cocorrelation Matrix plot lib
library(corrplot)
M <- cor(numdata)
#par(mfrow =c (1,2))
#corrplot(M, method = "square")
corrplot.mixed(M)
Then you will get Figure Correlation Matrix plot in R.
4.7. Source Code for This Section
The code for this section is available for download for R for Python,
Python
- Python Source code
'''
Created on Apr 25, 2016
test code
@author: Wenqiang Feng
'''
import pandas as pd
#import numpy as np
import matplotlib.pyplot as plt
from pandas.tools.plotting import scatter_matrix
from docutils.parsers.rst.directives import path

if __name__ == '__main__':
    path ='~/Dropbox/MachineLearningAlgorithms/python_code/data/Heart.csv'
    rawdata = pd.read_csv(path)

    print "data summary"
    print rawdata.describe()

    # summary plot of the data
    scatter_matrix(rawdata,figsize=[15,15])
    plt.show()

    # Histogram
    rawdata.hist()
    plt.show()

    # boxplot
    pd.DataFrame.boxplot(rawdata)
    plt.show()


    print "Raw data size"
    nrow, ncol = rawdata.shape
    print nrow, ncol

    path = ('/home/feng/Dropbox/MachineLearningAlgorithms/python_code/data/'
    'energy_efficiency.xlsx')
    path

    rawdataEnergy= pd.read_excel(path,sheetname=0)

    nrow=rawdata.shape[0] #gives number of row count
    ncol=rawdata.shape[1] #gives number of col count
    print nrow, ncol
    col_names = rawdata.columns.tolist()
    print "Column names:"
    print col_names
    print "Data Format:"
    print rawdata.dtypes

    print "\nSample data:"
    print(rawdata.head(6))


    print "\n correlation Matrix"
    print rawdata.corr()

    # cocorrelation Matrix plot
    pd.DataFrame.corr(rawdata)
    plt.show()

    print "\n covariance Matrix"
    print rawdata.cov()

    print rawdata[['Age','Ca']].corr()
    pd.DataFrame.corr(rawdata)
    plt.show()


    # define colors list, to be used to plot survived either red (=0) or green (=1)
    colors=['red','green']

    # make a scatter plot

    # rawdata.info()

    from scipy import stats
    import seaborn as sns # just a conventional alias, don't know why
    sns.corrplot(rawdata) # compute and plot the pair-wise correlations
    # save to file, remove the big white borders
    #plt.savefig('attribute_correlations.png', tight_layout=True)
    plt.show()


    attr = rawdata['Age']
    sns.distplot(attr)
    plt.show()

    sns.distplot(attr, kde=False, fit=stats.gamma);
    plt.show()

    # Two subplots, the axes array is 1-d
    plt.figure(1)
    plt.title('Histogram of Age')
    plt.subplot(211) # 21,1 means first one of 2 rows, 1 col
    sns.distplot(attr)

    plt.subplot(212) #  21,2 means second one of 2 rows, 1 col
    sns.distplot(attr, kde=False, fit=stats.gamma);

    plt.show()
R
- R Source code
rm(list = ls())
# set the enverionment
path ='~/Dropbox/MachineLearningAlgorithms/python_code/data/Heart.csv'
rawdata = read.csv(path)

# summary of the data
summary(rawdata)
# plot of the summary
plot(rawdata)

dim(rawdata)
head(rawdata)
tail(rawdata)

colnames(rawdata)
attach(rawdata)

# get numerical data and remove NAN
numdata=na.omit(rawdata[,c(1:2,4:12)])

cor(numdata)
cov(numdata)

dev.off()
# laod cocorrelation Matrix plot lib
library(corrplot)
M <- cor(numdata)
#par(mfrow =c (1,2))
#corrplot(M, method = "square")
corrplot.mixed(M)


nrow=nrow(rawdata)
ncol=ncol(rawdata)
c(nrow, ncol)


Nvars=ncol(numdata)
# checking data format
typeof(rawdata)
install.packages("mlbench")
library(mlbench)
sapply(rawdata, class)

dev.off()
name=colnames(numdata)
Nvars=ncol(numdata)
# boxplot
par(mfrow =c (4,3))
for (i in 1:Nvars)
{
  #boxplot(numdata[,i]~numdata[,Nvars],data=data,main=name[i])
  boxplot(numdata[,i],data=numdata,main=name[i])
}

# Histogram with normal curve plot
dev.off()
Nvars=ncol(numdata)
name=colnames(numdata)
par(mfrow =c (3,5))
for (i in 1:Nvars)
{
  x<- numdata[,i]
  h<-hist(x, breaks=10, freq=TRUE, col="blue", xlab=name[i],main=" ",
            font.lab=1)
  axis(1, tck=1, col.ticks="light gray")
  axis(1, tck=-0.015, col.ticks="black")
  axis(2, tck=1, col.ticks="light gray", lwd.ticks="1")
  axis(2, tck=-0.015)
  xfit<-seq(min(x),max(x),length=40)
  yfit<-dnorm(xfit,mean=mean(x),sd=sd(x))
  yfit <- yfit*diff(h$mids[1:2])*length(x)
  lines(xfit, yfit, col="blue", lwd=2)
}


library(reshape2)
library(ggplot2)
d <- melt(diamonds[,-c(2:4)])
ggplot(d,aes(x = value)) +
  facet_wrap(~variable,scales = "free_x") +
  geom_histogram()
