16. ALS: Stock Portfolio Recommendations
Chinese proverb
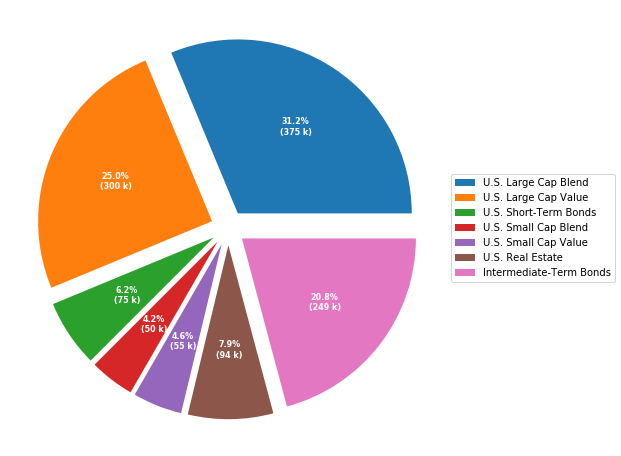
Don’t put all your eggs in one basket.
Code for the above figure:
import numpy as np
import matplotlib.pyplot as plt

fig, ax = plt.subplots(figsize=(10, 8), subplot_kw=dict(aspect="equal"))

recipe = ["375 k U.S. Large Cap Blend",
          "300 k U.S. Large Cap Value",
          "75 k U.S. Short-Term Bonds",
          "50 k U.S. Small Cap Blend",
          "55 k U.S. Small Cap Value",
          "95 k U.S. Real Estate",
          "250 k Intermediate-Term Bonds"]

data = [float(x.split()[0]) for x in recipe]
ingredients = [' '.join(x.split()[2:]) for x in recipe]

print(data)
print(ingredients)
def func(pct, allvals):
    absolute = int(pct/100.*np.sum(allvals))
    return "{:.1f}%\n({:d} k)".format(pct, absolute)

explode = np.empty(len(data))#(0.1, 0.1, 0.1,  0.1, 0.1, 0.1)  # explode 1st slice
explode.fill(0.1)

wedges, texts, autotexts = ax.pie(data, explode=explode, autopct=lambda pct: func(pct, data),
                                  textprops=dict(color="w"))
ax.legend(wedges, ingredients,
          #title="Stock portfolio",
          loc="center left",
          bbox_to_anchor=(1, 0, 0.5, 1))

plt.setp(autotexts, size=8, weight="bold")

#ax.set_title("Stock portfolio")

plt.show()
16.1. Recommender systems
Recommender systems or recommendation systems (sometimes replacing “system” with a synonym such as platform or engine) are a subclass of information filtering system that seek to predict the “rating” or “preference” that a user would give to an item.”
The main idea is to build a matrix users R items rating values and try to factorize it, to recommend main products rated by other users. A popular approach for this is matrix factorization is Alternating Least Squares (ALS)
16.2. Alternating Least Squares
Apache Spark ML implements ALS for collaborative filtering, a very popular algorithm for making recommendations.
ALS recommender is a matrix factorization algorithm that uses Alternating Least Squares with Weighted-Lamda-Regularization (ALS-WR). It factors the user to item matrix A into the user-to-feature matrix U and the item-to-feature matrix M: It runs the ALS algorithm in a parallel fashion. The ALS algorithm should uncover the latent factors that explain the observed user to item ratings and tries to find optimal factor weights to minimize the least squares between predicted and actual ratings.
https://www.elenacuoco.com/2016/12/22/alternating-least-squares-als-spark-ml/
16.3. Demo
The Jupyter notebook can be download from ALS Recommender systems.
The data can be downloaf from German Credit.
16.3.1. Load and clean data
Set up spark context and SparkSession
from pyspark.sql import SparkSession

spark = SparkSession \
    .builder \
    .appName("Python Spark RFM example") \
    .config("spark.some.config.option", "some-value") \
    .getOrCreate()
Load dataset
df_raw = spark.read.format('com.databricks.spark.csv').\
                       options(header='true', \
                       inferschema='true').\
            load("Online Retail.csv",header=True);
check the data set
df_raw.show(5)
df_raw.printSchema()
Then you will get
+---------+---------+--------------------+--------+------------+---------+----------+--------------+
|InvoiceNo|StockCode|         Description|Quantity| InvoiceDate|UnitPrice|CustomerID|       Country|
+---------+---------+--------------------+--------+------------+---------+----------+--------------+
|   536365|   85123A|WHITE HANGING HEA...|       6|12/1/10 8:26|     2.55|     17850|United Kingdom|
|   536365|    71053| WHITE METAL LANTERN|       6|12/1/10 8:26|     3.39|     17850|United Kingdom|
|   536365|   84406B|CREAM CUPID HEART...|       8|12/1/10 8:26|     2.75|     17850|United Kingdom|
|   536365|   84029G|KNITTED UNION FLA...|       6|12/1/10 8:26|     3.39|     17850|United Kingdom|
|   536365|   84029E|RED WOOLLY HOTTIE...|       6|12/1/10 8:26|     3.39|     17850|United Kingdom|
+---------+---------+--------------------+--------+------------+---------+----------+--------------+
only showing top 5 rows

root
 |-- InvoiceNo: string (nullable = true)
 |-- StockCode: string (nullable = true)
 |-- Description: string (nullable = true)
 |-- Quantity: integer (nullable = true)
 |-- InvoiceDate: string (nullable = true)
 |-- UnitPrice: double (nullable = true)
 |-- CustomerID: integer (nullable = true)
 |-- Country: string (nullable = true)
Data clean and data manipulation
check and remove the
nullvalues
from pyspark.sql.functions import count

def my_count(df_in):
    df_in.agg( *[ count(c).alias(c) for c in df_in.columns ] ).show()
import pyspark.sql.functions as F
from pyspark.sql.functions import round
df_raw = df_raw.withColumn('Asset',round( F.col('Quantity') * F.col('UnitPrice'), 2 ))
df = df_raw.withColumnRenamed('StockCode', 'Cusip')\
           .select('CustomerID','Cusip','Quantity','UnitPrice','Asset')
my_count(df)
+----------+------+--------+---------+------+
|CustomerID| Cusip|Quantity|UnitPrice| Asset|
+----------+------+--------+---------+------+
|    406829|541909|  541909|   541909|541909|
+----------+------+--------+---------+------+
Since the count results are not the same, we have some null value in the CustomerID column. We can drop these records from the dataset.
df =  df.filter(F.col('Asset')>=0)
df = df.dropna(how='any')
my_count(df)
+----------+------+--------+---------+------+
|CustomerID| Cusip|Quantity|UnitPrice| Asset|
+----------+------+--------+---------+------+
|    397924|397924|  397924|   397924|397924|
+----------+------+--------+---------+------+
df.show(3)

+----------+------+--------+---------+-----+
|CustomerID| Cusip|Quantity|UnitPrice|Asset|
+----------+------+--------+---------+-----+
|     17850|85123A|       6|     2.55| 15.3|
|     17850| 71053|       6|     3.39|20.34|
|     17850|84406B|       8|     2.75| 22.0|
+----------+------+--------+---------+-----+
only showing top 3 rows
Convert the
Cusipto consistent format
from pyspark.sql.functions import udf
from pyspark.sql.types import StringType, DoubleType

def toUpper(s):
    return s.upper()

upper_udf = udf(lambda x: toUpper(x), StringType())
Find the most top
nstockes
pop = df.groupBy('Cusip')\
  .agg(F.count('CustomerID').alias('Customers'),F.round(F.sum('Asset'),2).alias('TotalAsset'))\
  .sort([F.col('Customers'),F.col('TotalAsset')],ascending=[0,0])

pop.show(5)
+------+---------+----------+
| Cusip|Customers|TotalAsset|
+------+---------+----------+
|85123A|     2035|  100603.5|
| 22423|     1724| 142592.95|
|85099B|     1618|  85220.78|
| 84879|     1408|  56580.34|
| 47566|     1397|  68844.33|
+------+---------+----------+
only showing top 5 rows
16.3.2. Build feature matrix
Fetch the top
ncusip list
top = 10
cusip_lst = pd.DataFrame(pop.select('Cusip').head(top)).astype('str').iloc[:, 0].tolist()
cusip_lst.insert(0,'CustomerID')
Create the portfolio table for each customer
pivot_tab = df.groupBy('CustomerID').pivot('Cusip').sum('Asset')
pivot_tab = pivot_tab.fillna(0)
Fetch the most
nstock’s portfolio table for each customer
selected_tab  = pivot_tab.select(cusip_lst)
selected_tab.show(4)
+----------+------+-----+------+-----+-----+-----+-----+-----+----+-----+
|CustomerID|85123A|22423|85099B|84879|47566|20725|22720|20727|POST|23203|
+----------+------+-----+------+-----+-----+-----+-----+-----+----+-----+
|     16503|   0.0|  0.0|   0.0|  0.0|  0.0|  0.0|  0.0| 33.0| 0.0|  0.0|
|     15727| 123.9| 25.5|   0.0|  0.0|  0.0| 33.0| 99.0|  0.0| 0.0|  0.0|
|     14570|   0.0|  0.0|   0.0|  0.0|  0.0|  0.0|  0.0|  0.0| 0.0|  0.0|
|     14450|   0.0|  0.0|  8.32|  0.0|  0.0|  0.0| 49.5|  0.0| 0.0|  0.0|
+----------+------+-----+------+-----+-----+-----+-----+-----+----+-----+
only showing top 4 rows
Build the
ratingmatrix
def elemwiseDiv(df_in):
    num = len(df_in.columns)
    temp = df_in.rdd.map(lambda x: list(flatten([x[0],[x[i]/float(sum(x[1:]))
                                                       if sum(x[1:])>0 else x[i]
                                                       for i in range(1,num)]])))
    return spark.createDataFrame(temp,df_in.columns)

ratings = elemwiseDiv(selected_tab)
ratings.show(4)

+----------+------+-----+------+-----+-----+-----+-----+-----+----+-----+
|CustomerID|85123A|22423|85099B|84879|47566|20725|22720|20727|POST|23203|
+----------+------+-----+------+-----+-----+-----+-----+-----+----+-----+
|     16503|   0.0|  0.0|   0.0|  0.0|  0.0|  0.0|  0.0|  1.0| 0.0|  0.0|
|     15727|  0.44| 0.09|   0.0|  0.0|  0.0| 0.12| 0.35|  0.0| 0.0|  0.0|
|     14570|   0.0|  0.0|   0.0|  0.0|  0.0|  0.0|  0.0|  0.0| 0.0|  0.0|
|     14450|   0.0|  0.0|  0.14|  0.0|  0.0|  0.0| 0.86|  0.0| 0.0|  0.0|
+----------+------+-----+------+-----+-----+-----+-----+-----+----+-----+
Convert
ratingmatrix to long table
from pyspark.sql.functions import array, col, explode, struct, lit

def to_long(df, by):
        """
        reference: https://stackoverflow.com/questions/37864222/transpose-column-to-row-with-spark
        """

    # Filter dtypes and split into column names and type description
    cols, dtypes = zip(*((c, t) for (c, t) in df.dtypes if c not in by))
    # Spark SQL supports only homogeneous columns
    assert len(set(dtypes)) == 1, "All columns have to be of the same type"

    # Create and explode an array of (column_name, column_value) structs
    kvs = explode(array([
      struct(lit(c).alias("Cusip"), col(c).alias("rating")) for c in cols
    ])).alias("kvs")
df_all = to_long(ratings,['CustomerID'])
df_all.show(5)
+----------+------+------+
|CustomerID| Cusip|rating|
+----------+------+------+
|     16503|85123A|   0.0|
|     16503| 22423|   0.0|
|     16503|85099B|   0.0|
|     16503| 84879|   0.0|
|     16503| 47566|   0.0|
+----------+------+------+
only showing top 5 rows
Convert the string
Cusipto numerical index
from pyspark.ml.feature import StringIndexer
# Index labels, adding metadata to the label column
labelIndexer = StringIndexer(inputCol='Cusip',
                             outputCol='indexedCusip').fit(df_all)
df_all = labelIndexer.transform(df_all)

df_all.show(5, True)
df_all.printSchema()
+----------+------+------+------------+
|CustomerID| Cusip|rating|indexedCusip|
+----------+------+------+------------+
|     16503|85123A|   0.0|         6.0|
|     16503| 22423|   0.0|         9.0|
|     16503|85099B|   0.0|         5.0|
|     16503| 84879|   0.0|         1.0|
|     16503| 47566|   0.0|         0.0|
+----------+------+------+------------+
only showing top 5 rows

root
 |-- CustomerID: long (nullable = true)
 |-- Cusip: string (nullable = false)
 |-- rating: double (nullable = true)
 |-- indexedCusip: double (nullable = true)
16.3.3. Train model
build
trainandtestdataset
train, test = df_all.randomSplit([0.8,0.2])

train.show(5)
test.show(5)
+----------+-----+------------+-------------------+
|CustomerID|Cusip|indexedCusip|             rating|
+----------+-----+------------+-------------------+
|     12940|20725|         2.0|                0.0|
|     12940|20727|         4.0|                0.0|
|     12940|22423|         9.0|0.49990198000392083|
|     12940|22720|         3.0|                0.0|
|     12940|23203|         7.0|                0.0|
+----------+-----+------------+-------------------+
only showing top 5 rows

+----------+-----+------------+------------------+
|CustomerID|Cusip|indexedCusip|            rating|
+----------+-----+------------+------------------+
|     12940|84879|         1.0|0.1325230346990786|
|     13285|20725|         2.0|0.2054154995331466|
|     13285|20727|         4.0|0.2054154995331466|
|     13285|47566|         0.0|               0.0|
|     13623|23203|         7.0|               0.0|
+----------+-----+------------+------------------+
only showing top 5 rows
train model
import itertools
from math import sqrt
from operator import add
import sys
from pyspark.ml.recommendation import ALS

from pyspark.ml.evaluation import RegressionEvaluator

evaluator = RegressionEvaluator(metricName="rmse", labelCol="rating",
                                predictionCol="prediction")
def computeRmse(model, data):
    """
    Compute RMSE (Root mean Squared Error).
    """
    predictions = model.transform(data)
    rmse = evaluator.evaluate(predictions)
    print("Root-mean-square error = " + str(rmse))
    return rmse

#train models and evaluate them on the validation set

ranks = [4,5]
lambdas = [0.05]
numIters = [30]
bestModel = None
bestValidationRmse = float("inf")
bestRank = 0
bestLambda = -1.0
bestNumIter = -1

val = test.na.drop()
for rank, lmbda, numIter in itertools.product(ranks, lambdas, numIters):
    als = ALS(rank=rank, maxIter=numIter, regParam=lmbda, numUserBlocks=10, numItemBlocks=10, implicitPrefs=False,
              alpha=1.0,
              userCol="CustomerID", itemCol="indexedCusip", seed=1, ratingCol="rating", nonnegative=True)
    model=als.fit(train)

    validationRmse = computeRmse(model, val)
    print("RMSE (validation) = %f for the model trained with " % validationRmse + \
            "rank = %d, lambda = %.1f, and numIter = %d." % (rank, lmbda, numIter))
    if (validationRmse, bestValidationRmse):
        bestModel = model
        bestValidationRmse = validationRmse
        bestRank = rank
        bestLambda = lmbda
        bestNumIter = numIter

model = bestModel
16.3.4. Make prediction
make prediction
topredict=test[test['rating']==0]

predictions=model.transform(topredict)
predictions.filter(predictions.prediction>0)\
           .sort([F.col('CustomerID'),F.col('Cusip')],ascending=[0,0]).show(5)
+----------+------+------------+------+------------+
|CustomerID| Cusip|indexedCusip|rating|  prediction|
+----------+------+------------+------+------------+
|     18283| 47566|         0.0|   0.0|  0.01625076|
|     18282|85123A|         6.0|   0.0| 0.057172246|
|     18282| 84879|         1.0|   0.0| 0.059531752|
|     18282| 23203|         7.0|   0.0| 0.010502596|
|     18282| 22720|         3.0|   0.0| 0.053893942|
+----------+------+------------+------+------------+
only showing top 5 rows