Homework on Identification of Influential Observations
- required library in this homework
library(dplyr)
load data
dataC07 <- read.table("./data/APPENC07.txt", col.names = c('ID',
                  'SalesPrice','FinishedSquareFeet','NofBedrooms','NofBathrooms',
                  'AirConditioning','GarageSize','Pool','YearBuilt','Quality',
                   'Style','LotSize','AdjacenttoHighway'))
fit model
fit0 = lm(SalesPrice~.-Quality-Style, data=dataC07)
par(mfrow=c(2,2))
plot(fit0)
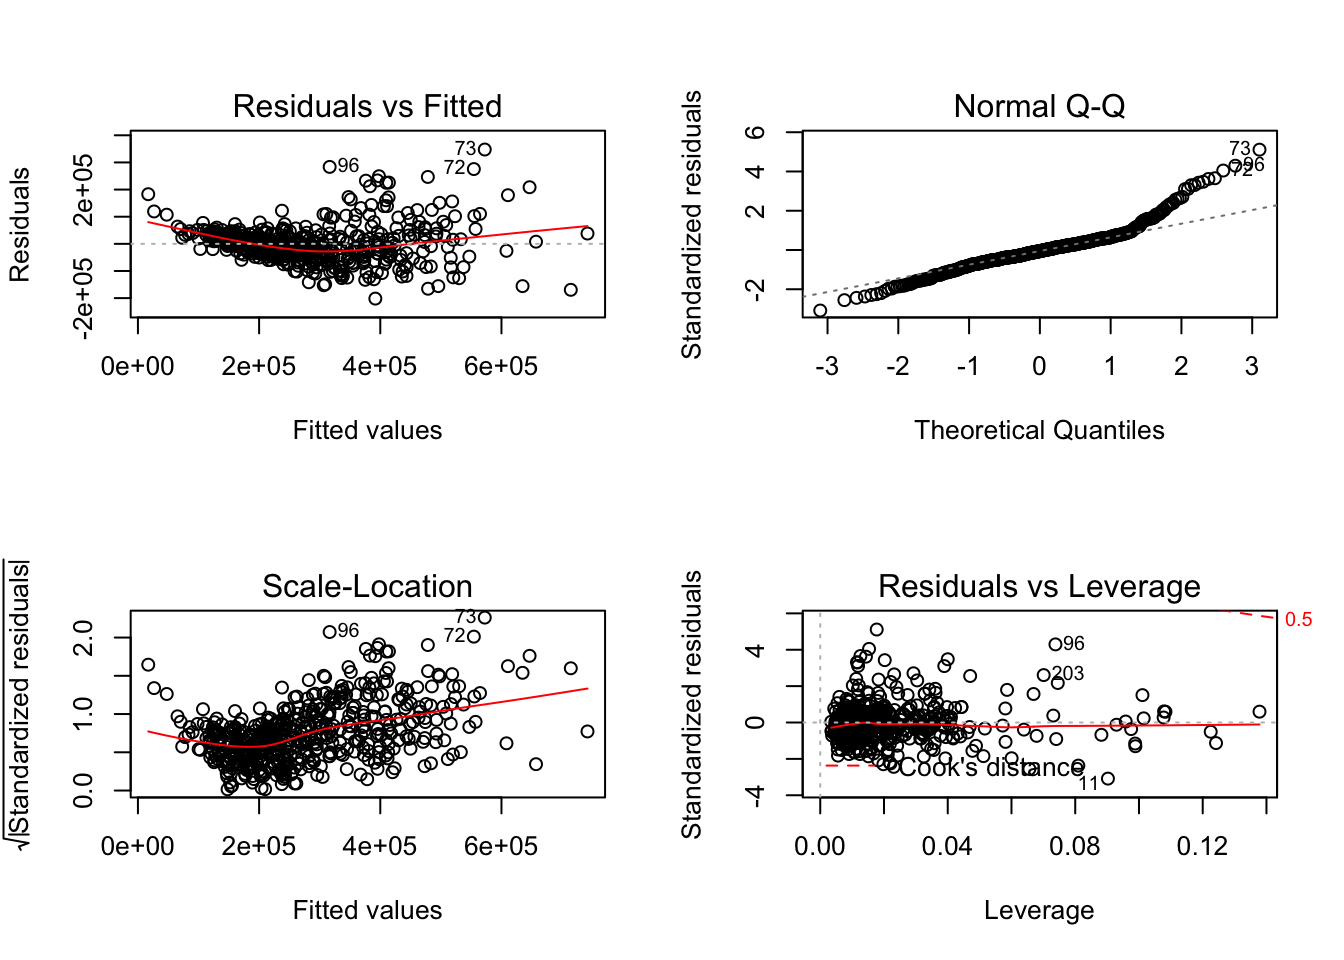
Find the index of influential observations which meet the following criteria: RSTUDENT > 4 or Cook’s D > 0.12 or CovRatio < 0.8
cd<-which(cooks.distance(fit0)>0.12)
covr<-which(covratio(fit0)< 0.8)
rst<-which(rstudent(fit0)>4)
index<-sort(unique(c(cd,covr,rst)))
index
## [1] 72 73 79 80 96
bulid table
DataTable <- cbind(index,rstudent(fit0)[index],
                   cooks.distance(fit0)[index],
                   covratio(fit0)[index])
colnames(DataTable) = c("ID value", "RSTUDENT", "Cook’s D","CovRatio")
DataTable
##    ID value RSTUDENT   Cook’s D  CovRatio
## 72       72 4.110688 0.02317113 0.7250078
## 73       73 5.243015 0.04284879 0.5838824
## 79       79 3.663288 0.01732241 0.7790232
## 80       80 3.700403 0.01550332 0.7732033
## 96       96 4.370469 0.13361571 0.7362033